TikTok video analytics are the built-in tools that pull back the curtain on your content. They show you how your videos are performing, who's watching them, and what's actually connecting with your audience. Think of analytics as the difference between just throwing content at the wall to see what sticks and having a repeatable recipe for growth.
Why TikTok Video Analytics Are Your Secret Weapon for Growth
Ever poured your heart into a video you were convinced would be a smash hit, only to watch it fizzle out? Or maybe you've posted something on a whim, watched it go viral, and were left scratching your head, wondering how to catch that lightning in a bottle again. That's a classic creator problem, and it's exactly what TikTok analytics is designed to solve. It removes the guesswork.

Instead of just creating and hoping, analytics gives you the "why" behind the numbers. It’s the difference between being a passenger on your content journey and getting firmly in the driver's seat.
Turning Guesswork into a Repeatable Strategy
Making content without looking at your data is like trying to navigate a new city without a map. Sure, you might get where you're going eventually, but you'll probably take a lot of frustrating wrong turns. TikTok analytics is your map, giving you clear directions based on what your audience is actually doing.
The sheer scale of the platform makes this data non-negotiable. With an insane 272 videos posted every single second—adding up to 34 million a day—you're competing in an incredibly noisy environment. Engagement is just as wild, with users spending an average of 58 minutes on the app every day, blowing past other platforms. You can check out more amazing TikTok insights to get a sense of just how massive it is. To stand out, you need more than creativity; you need a smart, data-backed plan.
By analyzing your performance, you shift from simply making videos to engineering content that is designed to capture attention, hold it, and convert viewers into loyal followers.
The Power of Data-Informed Creation
Digging into your analytics helps you answer the crucial questions that really move the needle on growth:
- What hooks are actually working? You can see the exact moment people scroll away, helping you perfect those critical first few seconds.
- Who is my real audience? Find out their demographics and when they're online most, so you can post for maximum impact.
- Which topics truly connect? Identify the themes and formats that rack up the most shares, comments, and saves.
- Where is my traffic coming from? Learn whether people are finding you on the For You page, through search, or from direct shares.
By using these insights, you can stop guessing and start consistently creating content that your audience is hungry for. This turns your creative process from a shot in the dark into a reliable, effective growth engine.
How to Access Your TikTok Analytics Dashboard
Before you can get your hands on all the juicy data TikTok has to offer, you have to unlock the feature first. A standard personal account won't show you any analytics, but don't worry—getting access is simple and completely free. All you need to do is switch to a Creator or Business account.
Think of this switch as telling TikTok you’re serious about creating content. In return, the platform hands you the keys to a powerful suite of tools designed to help you understand your audience and grow your reach. The best part? It only takes a minute and won't change your day-to-day experience on the app.
Making the Switch to a Creator or Business Account
If you're still using a personal account, it's time for a quick upgrade. Both Creator and Business accounts unlock analytics, but they serve slightly different purposes. A Creator account is usually the best fit for individual influencers and personalities, while a Business account is built for brands with more commercial needs.
Here’s how to make the switch in a few simple steps:
- Head to your Profile page (the icon in the bottom-right corner).
- Tap the three horizontal lines (the "hamburger" menu) in the top-right.
- Choose "Settings and privacy," then tap on "Account."
- From there, select "Switch to Business Account" or "Switch to Creator Account" and follow the quick on-screen instructions.
That's it! Once you've switched, TikTok starts gathering data on your profile and videos. Just a heads-up, it can take up to a week for the first set of analytics to show up, so a little patience is needed.
Navigating to Your Analytics Dashboard
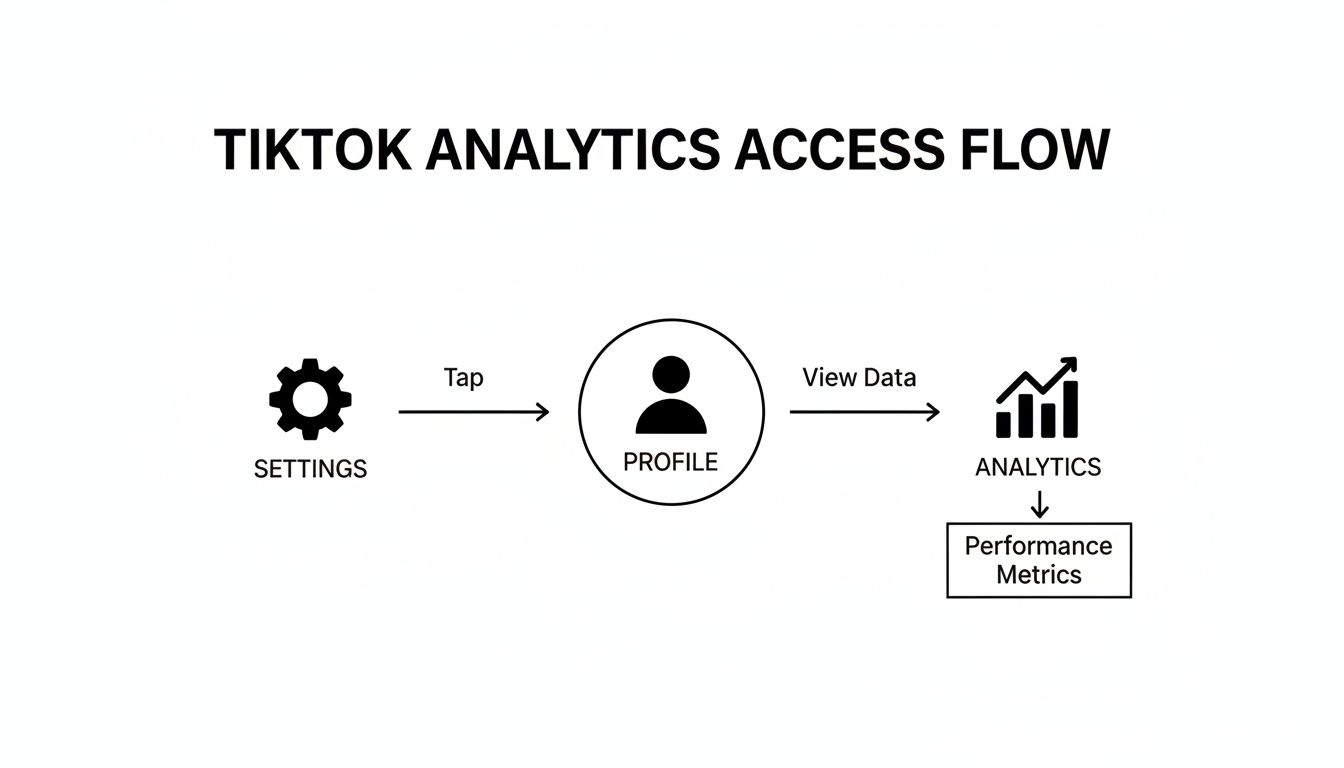
Once your account is upgraded and the data has had time to populate, finding your analytics is easy. This is your new command center for all things performance-related.
This is the menu you'll be looking for—your gateway to all the data.
As you can see, the "Analytics" option is front and center, so you can't miss it.
To find this screen, just go back to your profile, tap the three-line menu again, and select "Creator Tools" (or "Business Suite" if you have a Business account). "Analytics" will be the very first option. Tapping it takes you right into the main dashboard.
Once you’re in, you’ll find your data is neatly organized into four main tabs: Overview, Content, Followers, and LIVE. Each one gives you a different perspective on your performance, which is exactly what you need to start making sense of your TikTok video analytics.
Decoding the Most Important TikTok Video Metrics
Jumping into your TikTok analytics for the first time can feel like trying to decipher a secret code. You're hit with a wall of numbers and graphs—views, reach, watch time—but what does it all really mean for your content?
Here’s the secret: these aren't just dry data points. Think of them as direct messages from your audience and the TikTok algorithm, telling you exactly what’s working and what’s not. Learning to read this feedback is the single most important skill for growing your account. It’s the difference between guessing what to post next and knowing what your audience craves.
Each metric tells a piece of a larger story about your video's journey. Let's break down what they mean.
Before we dive in, let's take a quick look at the core metrics you'll be working with. This table is a handy reference for the key players in your analytics dashboard.
Key TikTok Video Analytics and What They Mean
| Metric Name | What It Measures | Why It's Important |
|---|---|---|
| Video Views | The total number of times your video has been played. | A basic measure of initial interest, but doesn't tell the whole story. |
| Reach | The number of unique accounts that saw your video. | A better indicator of true audience growth and how far your content is spreading. |
| Average Watch Time | The typical duration a viewer watches your video before swiping away. | Arguably the most important metric for the algorithm; it signals content quality. |
| Watched Full Video | The percentage of viewers who watched your video from start to finish. | The ultimate test of your hook, pacing, and payoff. High rates feed the algorithm. |
| Engagement Rate | The percentage of viewers who liked, commented, or shared your video. | Measures how actively your audience is interacting with your content. |
| Traffic Sources | The breakdown of where your views came from (e.g., For You, Following). | Reveals how people are discovering you and whether you've hit the algorithm's sweet spot. |
Now that we've got the lay of the land, let's explore what these numbers actually tell you about your performance.
Video Views and Reach: The First Impression
Video Views is the number everyone chases. It’s simple: the total number of times your video started playing. But be careful—a "view" is counted the instant the video starts, even if someone scrolls past in a split second.
That's why Reach is so much more insightful. It tells you how many unique people saw your video. If one person watches your clip five times, that’s five views but only one person reached.
- High Views, Low Reach? This usually means your existing followers are watching your video over and over. That's a great sign of a loyal community!
- High Views, High Reach? Ding, ding, ding! This is the goal. It means your video has broken out beyond your followers and is being pushed to new audiences on the For You page.
Think of views as foot traffic past your storefront. Reach is how many different shoppers walked by. You need both, but reach is the true measure of growth.
Watch Time and Retention: The Stickiness Factor
If views are about getting people in the door, watch time is about how long they decide to stay. This is what the TikTok algorithm really cares about.
Total Watch Time is the grand sum of all minutes and seconds people have spent on your video. But the golden metric here is Average Watch Time. This tells you, on average, how long people stick around. For a 30-second video, an average watch time of 25 seconds is a massive win.
A high average watch time sends a powerful signal to TikTok: "People are loving this content. Show it to more users!" This is how videos gain momentum and land on more For You pages.
Dig even deeper with the Watched Full Video percentage. This shows you exactly how many viewers made it to the very end. A high completion rate proves your hook grabbed them, your story held them, and your ending delivered.
Engagement Metrics: The Audience Vote
Likes, comments, and shares are your audience's applause. They aren't just passively watching; they’re actively participating. Each action tells you something different.
- Likes: The quick double-tap. It's the simplest nod of approval, saying, "I enjoyed this."
- Comments: This is a much stronger signal. Your video sparked a thought, a question, or an emotion so strong that someone had to type out a response.
- Shares: The holy grail of engagement. Someone found your video so good they sent it to a friend or reposted it. Shares are a huge driver of virality because they're a personal endorsement.
To put it all together, you can calculate your Engagement Rate. A common formula is (Likes + Comments + Shares) ÷ Views x 100. If you want to get really precise, you can learn more about how to calculate your TikTok engagement rate and what benchmarks to aim for.
Traffic Sources: Where Your Audience Found You
The Traffic Source Types dashboard is your roadmap. It shows you exactly how people stumbled upon your video, which is crucial for understanding your distribution strategy.
- For You Page: This is what you're aiming for. A high percentage of traffic from the FYP means the algorithm loves your video and is serving it to a massive, relevant audience. This is your engine for explosive growth.
- Following Feed: These are your loyalists—the people who already follow you. A healthy number here shows you're keeping your core community happy.
- Profile: This means someone liked your video enough to visit your profile and see what else you've got. It’s a great sign that your content is making people curious.
- Search: This is pure gold. It means people found your video by typing in keywords. This proves how important it is to use relevant terms in your description, text overlays, and hashtags.
- Sound: If you use a trending sound, people can discover your video by tapping the sound icon on someone else's post. It's a fantastic shortcut to discovery.
Seeing that 90% of your views came from the For You page confirms you’ve gone viral. Seeing a spike from Search tells you your keyword strategy is on point. Your analytics give you the map; it's your job to follow it.
Interpreting Your Data to Find Winning Content Patterns
Having a dashboard full of TikTok video analytics is one thing, but turning those numbers into a powerful content strategy is where the real magic happens. Think of yourself as a data detective, hunting for the stories and patterns hidden inside the graphs. Every metric is a clue, and learning to read these clues will completely change how you create.
Instead of seeing isolated numbers, start looking for connections. Your analytics tell a story about a viewer's journey through your video, from the initial hook to the final second. When you understand the common patterns, you can diagnose your content’s strengths and weaknesses with pinpoint accuracy.
Reading the Story in Your Metrics
Your analytics are basically a direct feedback loop from your audience. Certain combinations of metrics point to specific, actionable insights about how your video landed. Getting good at spotting these scenarios is key to sharpening your strategy.
Here are a few common patterns and what they’re telling you:
Scenario 1: High Views, Low Average Watch Time
This is a classic. It means you’ve got a brilliant hook that grabs attention, but the content that follows doesn't deliver on the initial promise. Your first three seconds are doing their job, but people are losing interest and swiping away. Ask yourself: Was the video misleading? Did the energy drop off? Does the rest of the video match the excitement of the opening?Scenario 2: Low Views, High Average Watch Time & Engagement
Don't get discouraged by this one! It often means you’ve created something for a passionate niche. The video might not have broad, viral appeal, but it really resonates with the specific audience that found it. This is a powerful signal to double down on that topic or style—you've found a loyal corner of your community.Scenario 3: High Shares, Moderate Views
A video with a ton of shares is one that people find incredibly useful, relatable, or just plain entertaining. It's so good they want their friends to see it. This is a huge indicator of content with viral potential because it's getting a personal recommendation from viewers. Figure out what made it so shareable—was it a life hack, a hilarious take, or an emotional story?
Finding Your Top Performers
Your most valuable insights often come from dissecting your breakout hits. Pop over to the "Content" tab in your analytics dashboard. Here, you can sort your videos by views, likes, comments, and shares over the last seven days to quickly see what’s been crushing it.
Once you have a list of your winners, don't just celebrate the high numbers—investigate them. For each top video, break down the elements that could have contributed to its success:
- The Format: Was it a tutorial, a skit, a talking-head video, or a trending dance?
- The Sound: Did you use a trending audio clip that gave it an algorithmic boost?
- The Topic: Did you touch on a subject that is particularly relevant or interesting to your audience right now?
- The Hook: What happened in the first three seconds? Did you use bold on-screen text or a surprising visual?
- The Editing: Was the pacing fast? Did you use quick cuts, zooms, or special effects?
By finding these common threads, you can start to build a formula for what works specifically for your audience. This data-driven approach lets you create repeatable templates for success. You can also use this information to perform a more effective TikTok competitor analysis, seeing how your winning patterns stack up against others in your niche.
The goal isn’t to copy your old videos exactly but to understand the underlying principles that made them succeed. This turns analytics from a report card into a playbook for future content.
The financial stakes behind this data-driven approach are getting bigger every day. TikTok's revenue from video-driven commerce and ads shows a rapidly maturing ecosystem. By 2025, TikTok Shop's Gross Merchandise Value (GMV) is projected to hit $30 billion. In the US alone, revenue has already reached $10 billion, with American users spending around $1,200 annually on the platform. For creators and marketers, this means that optimizing for higher completion rates and shares directly translates into real-world value. You can discover more insights about TikTok's impressive growth on Buffer.com.
How to Use Analytics to Make Better Videos
Think of your TikTok analytics as a direct conversation with your audience. They’re telling you exactly what they love, what bores them, and what makes them stop scrolling. Now, it's time to translate that feedback into a real-world game plan. By tying specific data points to your creative decisions, you can stop guessing and start building a content strategy that actually works.

This isn't about chasing empty numbers. It’s about making smart, deliberate choices that lead to real growth. Every metric you've looked at can inform a specific part of your creative process, from the first frame of your video to the final call to action.
Boosting Watch Time and Retention
The TikTok algorithm is obsessed with one thing above all else: videos that keep people on the app. A high average watch time is the strongest signal you can send that your content is top-notch. If your analytics show a big drop-off in the first few seconds, that's a glaring sign that your intro isn't hooking people.
Here are a few proven ways to get people to watch longer:
Master the Pattern Interrupt: Our brains are hardwired to notice anything new or unexpected. Break up a static shot with a quick zoom, a text pop-up, or a sudden camera angle change. These little jolts reset a viewer's attention and keep their thumb from swiping away.
Use Strategic On-Screen Text Hooks: The first three seconds are everything. Open with bold text that poses a burning question or makes a provocative statement that your video promises to answer. For example, "You've been making coffee wrong your whole life" is way more interesting than just a pretty shot of a coffee mug.
Build a Mini-Story: Even a 15-second video can have a beginning, middle, and end. Set up a problem, show the journey to solve it, and deliver a satisfying payoff. This simple narrative structure keeps viewers invested until the very end, which is crucial for boosting your Watched Full Video rate.
Your goal is to make viewers feel like they have to see what happens next. When your Average Watch Time starts climbing, you’ll know these creative adjustments are working.
Driving Engagement and Interaction
Metrics like comments and shares tell the algorithm that your content is sparking a real conversation. While passive views are nice, it's the active participation that builds a true community and gives your video a shot at going viral. If your engagement rates are flat, it's time to be more direct in asking for it.
To get your audience involved, you need to create content that feels less like a broadcast and more like the start of a two-way dialogue. People are much more likely to jump in when they feel like they've been invited to the party.
Here’s how to encourage more interaction:
Ask Dead-Simple Questions: End your video by asking something incredibly easy to answer. Instead of a vague "What do you think?" try something specific and low-effort, like "Which color do you like more, A or B?"
Use TikTok's Interactive Stickers: Features like polls and quizzes are built for one reason: to drive interaction. Use them to let your audience vote on your next video idea, test their knowledge, or share their opinion right there in the video.
Create "Stitchable" or "Duetable" Content: Intentionally leave a prompt in your video that practically begs for a response. A video starting with, "Tell me about a time you messed up at work without telling me..." is just asking to be stitched.
Pinpointing the Perfect Time to Post
One of the most valuable—and often overlooked—tools in your analytics is the Followers tab. This is where TikTok shows you the exact days and hours when your audience is most active on the app. Posting during these peak windows gives your video the best possible launchpad.
Think of it like opening a new shop. You want to unlock the doors when the street is packed with people, not when everyone's at home asleep. A strong initial wave of engagement from your existing followers signals to the algorithm that this is good stuff, which can help push it onto the For You page for everyone else.
Make a habit of checking your Follower activity graph every week. Look for the 2-3 hour block where activity is highest and schedule your best videos to go live right as that window opens. This simple, data-backed tweak can make a massive difference in a video's initial reach and set it on the path to success.
Turning Your Analytics into a Content Creation Engine
Let's be real—the whole point of digging into your TikTok analytics isn't just to see how your last video did. The real magic happens when you let that data drive what you create next. It’s about closing the loop and building a system where your insights become your creative fuel.
Think of it as a constant conversation with your audience. You analyze their feedback (your metrics), spot what they loved, and then brainstorm new ideas based on those winning themes. You create, you post, you analyze again. This turns your analytics from a simple report card into a powerful playbook for your next viral hit.
Building a Content Plan That Actually Works
Your best-performing videos are a treasure map. They're literally showing you what your audience wants to see. If you notice a certain format—say, a quick-cut tutorial or a specific brand of dry humor—is consistently crushing it with watch time, that’s your signal. Build a whole content pillar around that style.
For example, imagine you post a one-off video about a quirky productivity hack, and it gets way more shares and saves than usual. Your audience isn't just watching; they're screaming, "More of this, please!" That’s your cue. Turn that single idea into a whole series and give the people what they want.
A data-first approach lets you find content gaps and opportunities before your competitors even know they exist. A weird spike in engagement on a niche topic is gold—it tells you there's an underserved interest just waiting for you to tap into it.
From Numbers to Actionable Ideas
The trick is to connect the dots between a specific metric and a creative concept. Did one video send a ton of people to your profile? That means it made them curious about who you are. A great follow-up would be a video that directly answers common questions or dives deeper into that same topic.
This kind of strategic thinking is non-negotiable on a platform as massive as TikTok. By early 2025, the app is projected to hit 1.59 billion monthly active users, which is a staggering 19.4% of the world's ad-reachable population. This global audience, from Asia-Pacific to Latin America, is a rich source of data you can use to carve out your own unique space. You can get a full breakdown of TikTok's worldwide user statistics on BrowserAct.com.
To make this whole process smoother, you can lean on tools that help turn raw data into fresh ideas. For instance, combining your analytics with a bit of TikTok social listening can uncover trending sounds or conversations that perfectly match your proven content pillars. This ensures your next video isn't just a shot in the dark—it's strategically sound and creatively inspired.
A Few Common Questions About TikTok Analytics
Even after you get the hang of the dashboard, you're bound to have some questions pop up. Let's tackle a few of the most common ones that creators run into.
How Many Followers Do I Need to See Analytics?
Good news: you don't need a single follower to unlock the main analytics dashboard. As soon as you switch your account over to a Creator or Business profile, you can start peeking at your data.
But there's a small catch for the really juicy stuff. To see detailed demographic data in the Followers tab—like where your audience lives or when they're most active—you'll need at least 100 followers. TikTok does this to make sure the data is broad enough to be useful while keeping individual user information anonymous.
Why Did My TikTok Analytics Disappear?
It’s a heart-stopping moment: you go to check your stats, and the analytics dashboard is blank or just won't load. Don't panic! This happens sometimes, and the fix is usually pretty simple.
First, try the classic "turn it off and on again" approach—fully close the TikTok app and relaunch it. If that doesn't do the trick, head to the app store to make sure your app is updated to the latest version. Old versions can get a bit buggy.
Still nothing? It’s probably a cache issue. Just go to your "Settings and Privacy," scroll down until you see the "Clear cache" option, and tap it. This is like a digital spring cleaning for the app; it clears out temporary files that might be causing the glitch, and it won't delete any of your precious drafts or videos.
How Often Does TikTok Update Analytics?
TikTok analytics update pretty quickly, but here's a key detail many people miss: the data runs on Coordinated Universal Time (UTC). This means the "day" for your analytics resets at midnight UTC, not in your local time zone.
This is super important to remember when you're looking at daily performance or follower activity. If you see a weird spike in views at 3:00 AM your time, it might not be a fluke. It could actually be prime time for an audience in a completely different part of the world that's loving your content.
Ready to turn these insights into your next viral video? Viral.new is an AI-powered idea generator that analyzes what’s trending in your niche and delivers ready-to-shoot video concepts to your inbox daily. Stop guessing and start creating with data-backed ideas.
