TikTok account analytics are the built-in tools that give you a behind-the-scenes look at your account’s performance, video metrics, and follower demographics. The best part? Getting access is easy. Just switch your personal profile to a free Creator or Business account in your settings, and you'll unlock a powerful dashboard full of insights.
Why Your TikTok Analytics Are a Goldmine

Let's be real—staring at numbers and graphs can feel like a chore. But what if those numbers could tell you exactly what your audience wants to see next? This is where your analytics stop being homework and become your creative secret weapon, revealing the "why" behind your viral hits and your quiet flops.
In a sea of creators all fighting for attention, a data-backed strategy is what separates the creators who build a lasting presence from those who burn out. Think of analytics less as a vanity report and more as a way to decode your audience's behavior and find the content patterns that the algorithm favors.
The Foundation for Smarter Content
Before you can build a killer content strategy, you need to unlock the data. The first and most critical step is switching your personal account over to either a Creator or Business profile. It’s a simple change that costs you nothing and gives you the keys to the entire analytics suite.
- Creator Account: This is perfect for individual influencers, artists, and public figures. It’s packed with detailed performance data and audience insights designed for content creation.
- Business Account: This one is built for brands, retailers, and organizations. You get everything in the Creator account, plus commercial tools like a website link in your bio and access to the commercial music library.
The real magic of your TikTok analytics isn't just seeing what worked. It's understanding why it worked so you can do it again on purpose, turning random luck into a repeatable formula for success.
A quick look at the main analytics tabs inside your TikTok account and what they reveal.
| Your Core TikTok Analytics Dashboards | ||
|---|---|---|
| Analytics Tab | What It Tells You | Primary Use Case |
| Overview | A high-level summary of your account's performance over 7, 28, or 60 days. | Quickly check key metrics like video views, profile views, and follower growth to spot overall trends. |
| Content | In-depth metrics for each individual video you've posted. | Dive deep into what makes a specific video succeed or fail by analyzing watch time, traffic sources, and audience retention. |
| Followers | A detailed demographic breakdown of your audience. | Understand who is watching your content—their location, gender, and most active times—to tailor your content and posting schedule. |
| LIVE | Performance data for your TikTok LIVE sessions. | Analyze your live streams to see viewer count, diamonds earned, and viewer engagement to improve future broadcasts. |
Each of these dashboards provides a different piece of the puzzle, helping you build a complete picture of your account's health and your audience's interests.
Why This Data Matters More Than Ever
The sheer size of TikTok's audience makes data absolutely essential. As the platform grows, so does the competition. With projections estimating between 1.59 billion and 1.67 billion monthly active users by early 2025, the algorithm has gotten much smarter. The average user now spends around 58 minutes a day on the app, which makes metrics like average watch time and video completion rate incredibly powerful signals for the recommendation engine. You can find more great insights into these trends in Buffer's latest report on TikTok statistics.
This shift means that just getting a view isn't enough anymore. Your analytics dashboard is the only tool you have that tells you if you’re actually holding that massive audience’s attention.
Navigating Your TikTok Analytics Dashboard
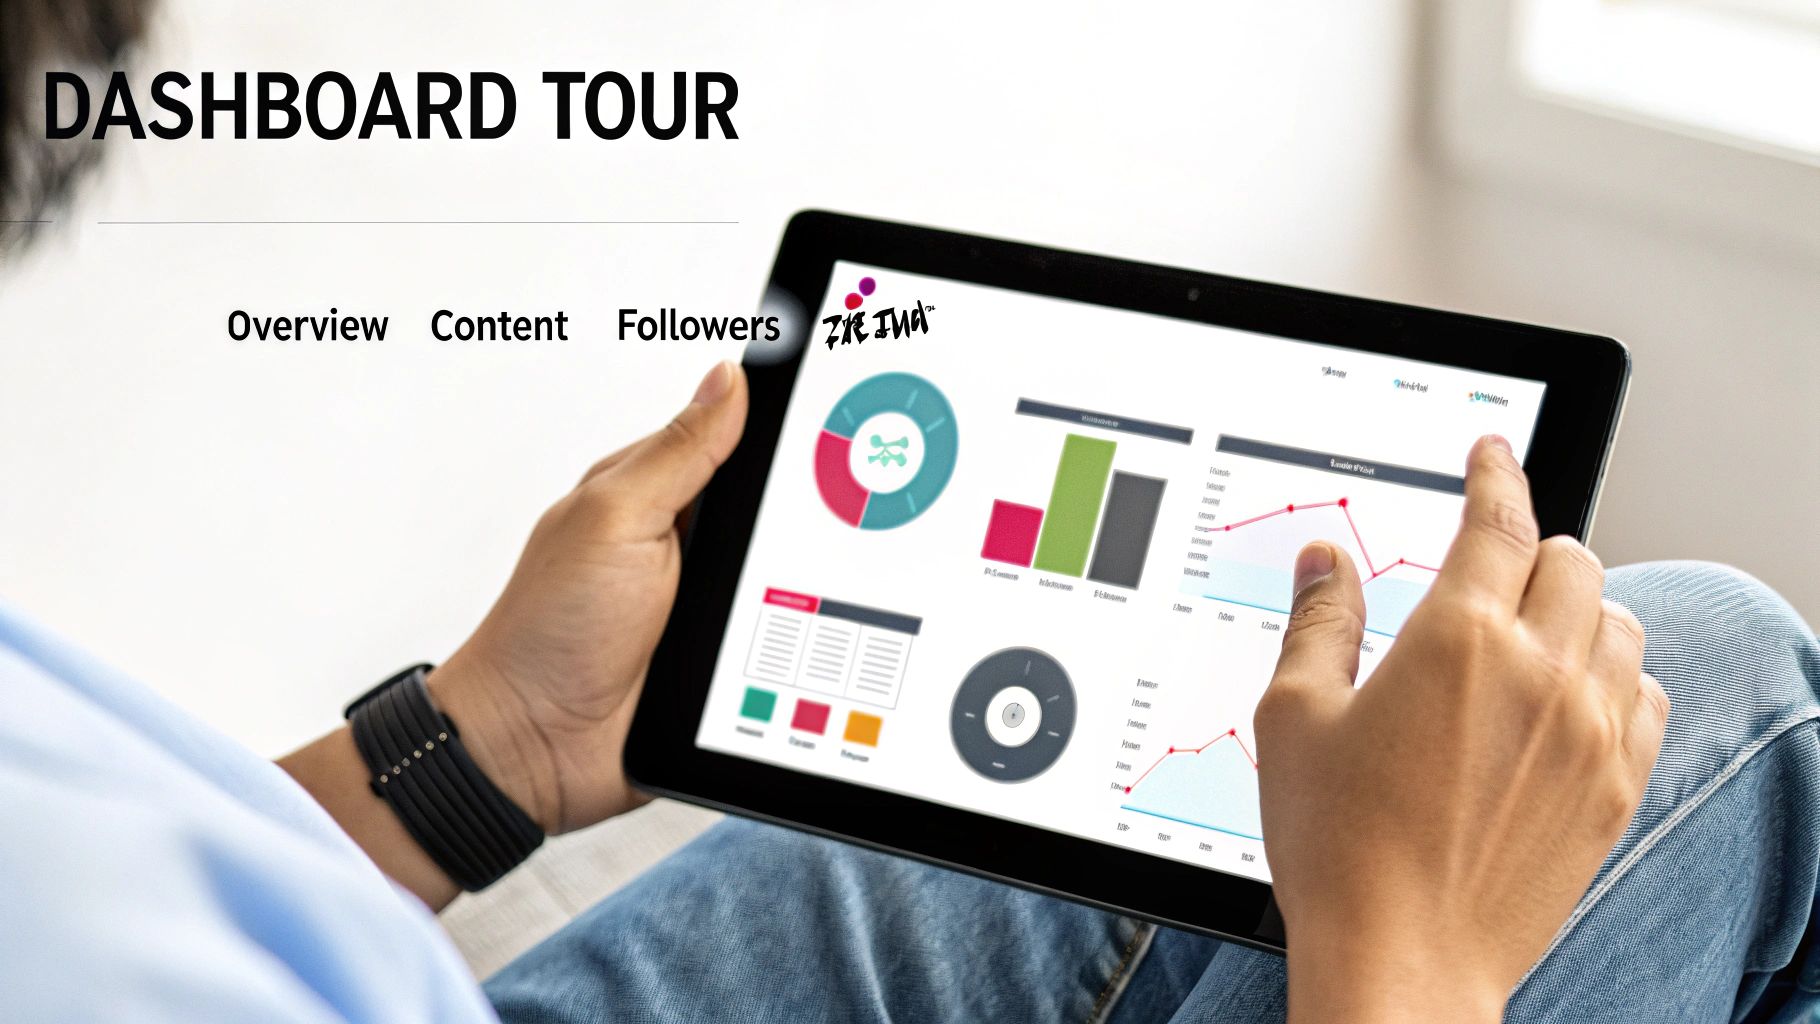
Alright, now that you've got your Creator or Business account set up, let's get you to the good stuff. From your profile, tap the three lines in the top-right corner, head into "Creator tools," and then tap "Analytics." This is your new command center, and it’s broken down into three main sections that tell the story of your account's performance.
Don't let the word "analytics" intimidate you. Think of this dashboard less like a scary spreadsheet and more like a direct feedback loop from your audience. It’s built to show you exactly what’s working and what isn’t.
The Overview Tab: Your 30,000-Foot View
The first place you’ll land is the Overview tab. I always start here to get a quick pulse check on my account's health. You can toggle the date range between 7, 28, or 60 days to see how key metrics like video views, profile views, and your follower count are trending.
This is where you spot the patterns. Say you notice a massive spike in profile views last Monday. Your next move is to look at what you posted that day. Something in that video was compelling enough to make people curious about your whole profile—that’s a huge win and a clear signal to double down on that topic or style.
The Content Tab: Getting Into the Weeds
Next up is the Content tab, and this is where the real detective work happens. This section breaks down the performance of every single video, letting you see what truly resonates. It’s not just about total views; you get to see which videos earned the most shares, comments, and favorites.
Here's a real-world scenario. You post two videos on the same topic. One gets 10,000 views and 50 shares, while the other hits 100,000 views with 1,000 shares. The Content tab helps you uncover the why. You might find the viral hit had a much higher average watch time, telling you the hook in the first three seconds was far more effective.
Your TikTok analytics are more than just numbers; they're a to-do list in disguise. High shares mean your content is relatable. High comments mean you’re starting a conversation. Every metric is a clue telling you what to do next.
The Followers Tab: Know Your Audience
Finally, we have the Followers tab. This is where you get a detailed demographic snapshot of your community, which is absolutely critical for making content that actually lands.
Inside, you'll find:
- Gender distribution: Who are you speaking to?
- Top territories: Where in the world are your followers watching from?
- Follower activity: The exact hours and days your audience is most active on TikTok.
This data is pure gold. If you learn that a huge chunk of your audience is in a different time zone, you can start scheduling your posts to go live when they’re scrolling. Knowing their most active hours helps you post at the perfect time to get that crucial initial burst of engagement, which is a powerful signal to the algorithm.
What Views and Likes Are Really Telling You
It’s easy to get a rush from a high view count or a flood of likes, but those numbers are just the tip of the iceberg. To truly grow, you need to look past the vanity metrics and understand the story your data is telling you. This is where you shift from just being a content creator to being a content strategist, and it all starts in your Overview and Content tabs.
Think about it this way: a sudden spike in Comments means you didn't just post a video; you started a conversation. You struck a chord. A high number of Shares is even better. That’s a personal endorsement—someone liked your video so much they put their own reputation on the line to send it to a friend. These aren't just numbers; they're signals of a real human connection.
The Metrics That Move the Needle
Some analytics tell you a much deeper story about your video's quality and, more importantly, how the TikTok algorithm sees it. The algorithm has one primary goal: keep people on the app longer. It rewards content that proves it can hold an audience's attention.
That's why your single most important metric is Average Watch Time. This tells you, flat out, if your video was actually interesting. A video with a million views but a two-second average watch time is, in the algorithm's eyes, a dud. It signals that your hook promised something your content didn't deliver.
Another golden metric is Full Video Watched. This is the percentage of people who stuck it out until the very end. A high percentage here is a massive green light for the algorithm, telling it, "Hey, people love this, show it to more of them!"
A high view count gets your attention, but a high average watch time gets the algorithm's attention. Focus on the metric that leads to sustainable growth, not just a fleeting viral moment.
Turning Data Into Your Next Big Idea
Let's walk through a real-world scenario. You post a 30-second video. It hits 50,000 views in a few hours—awesome! But then you check the analytics. Your Average Watch Time is a brutal four seconds. You pull up the retention graph and see a cliff-like drop-off right after the three-second mark.
Don't be discouraged. This is valuable intel. It tells you:
- Your hook was a winner. Whatever you did in those first three seconds was strong enough to stop the scroll.
- Your follow-through failed. The content immediately after the hook didn't live up to the hype, causing people to swipe away instantly.
- Your call-to-action never landed. With almost everyone leaving early, your prompt to follow or comment at the end was seen by virtually no one.
This isn't a failure; it’s a blueprint for your next video. Pinpoint what happened right at that three-second mark. Did the music change? Did you switch topics too abruptly? The next step is clear: Recreate that killer hook but build a much stronger, more engaging middle to carry viewers through to the end. This is how you use data to get better with every post.
Putting Your Engagement in Context
It's also crucial to compare apples to apples. On the content front, while the average engagement rate for a TikTok business account hovers around 7.8%, that number fluctuates wildly depending on the size of the account. For more context, you can explore these TikTok statistics on Tekrevol.
Comparing your numbers to a creator with millions of followers is a recipe for frustration. The real goal is to consistently improve upon your own baseline. To get a handle on this, check out our guide on how to calculate your TikTok engagement rate. It'll help you set realistic goals for your account's size and niche so you can build a strategy that actually works for you.
Getting to Know Your Audience on a Deeper Level
Your follower count is just a number. Your audience, on the other hand, is a real community of people. The Followers tab in your analytics is where you get to meet them—to turn that abstract number into a vivid picture of who they are, where they live, and what makes them tick. This isn't just about collecting data; it's about finding your roadmap to creating content they genuinely care about.
When you move past the surface-level metrics, you can start building a real connection. Your content strategy stops being guesswork and becomes a data-informed conversation, which means every video you create has a much better chance of hitting the mark.
Decoding Follower Growth and Geography
Think of your follower growth chart as one of the most direct feedback loops you have. It shows your net follower changes over time, helping you pinpoint the exact videos that brought new people into your circle. Did you see a huge spike last Tuesday? Go check what you posted that day. That topic, that hook, or that specific format is a proven winner for attracting new fans.
This data is your blueprint for repeatable success. It literally answers the question, "What kind of content actually grows my account?"
But knowing who is following you is only half the story; knowing where they are is a massive strategic advantage. The Top Countries and Top Cities breakdown tells you exactly where in the world your content is making an impact.
- Inspire new content: Are you a food creator noticing a big audience popping up in Mexico? Maybe it's time for a series on authentic regional dishes.
- Refine your sound choices: A growing following in Japan could be a signal to try incorporating trending Japanese audio for a surprising boost.
- Localize your approach: If a specific city like London shows up in your top five, you can weave in some local humor or references that make that part of your audience feel seen.
This geographical info helps you make your content feel more personal and relevant, which is absolutely crucial for building a loyal community on a global platform.
Mastering Follower Activity for Peak Engagement
The Follower Activity graph is, without a doubt, one of the most powerful tools in your entire analytics suite. It shows you the exact days and hours your followers are scrolling on TikTok. Most people glance at this and just look for the "best time to post," but that's barely scratching the surface of its potential.
Knowing when your audience is online is less about finding a single magic posting time and more about identifying prime opportunities to engage, spark conversations, and build community in real-time.
For example, if your data shows a massive activity spike at 8 PM on Thursdays, that’s your golden hour. Don't just post and walk away. That's the perfect time to host a Q&A in the comments, go LIVE to discuss a hot topic, or premiere a video you've been hyping up. You can transform a simple video drop into a live community event.
This data also gives you clues about your audience's daily routine. See a smaller-but-consistent peak around lunchtime on weekdays? That’s your slot for quick, snackable content that’s easy to watch on a break. Matching your content style to your audience's daily rhythm is an advanced tactic that really pays off. If you want to dive even deeper, you can learn more about effective TikTok social listening strategies to understand the conversations your community is having during these peak hours.
Building a Smarter Content Strategy with Data
Let's be real: raw data is just a bunch of numbers until you figure out what to do with it. Your TikTok analytics dashboard is the key to unlocking your next viral video, but you need a system to translate those metrics into a real content strategy. This is about more than just glancing at view counts; it's about building a routine that gives you repeatable insights.
First things first, schedule a time to look at your analytics every single week. A weekly check-in is the sweet spot. It gives your videos enough time to work their way through the algorithm and collect meaningful data, and it stops you from overreacting to tiny, day-to-day ups and downs. The goal here is simple: find your "golden content." Pinpoint the formats, topics, and sounds that consistently crush your average performance.
From Observation to Actionable Questions
Seeing that a video did well is one thing. Understanding why it did well is where the magic happens. You need to start asking sharp questions that lead directly to your next move. This is how you stop throwing content at the wall and start building a real formula for success.
Observation: "Huh, that video with the big text overlay got 50% more shares than anything else this week."
Actionable Question: "Okay, how can I test this? I'll add compelling text overlays to my next three video ideas and see if this share rate holds up."
Observation: "Wow, the average watch time on my 60-second tutorial was double my account average."
Actionable Question: "What other quick, high-value skills could I break down in a 60-second format? Let me plan a few for this month."
This subtle shift—from just looking at numbers to actively questioning them—is the heart of a data-driven plan. It turns every piece of content into a mini-experiment.
Don't just collect data; interrogate it. Force yourself to ask why something worked. Your next content plan should be built around that answer. This is how you stop guessing and start creating with genuine purpose.
This flow chart breaks down the exact audience insights you should be digging into.
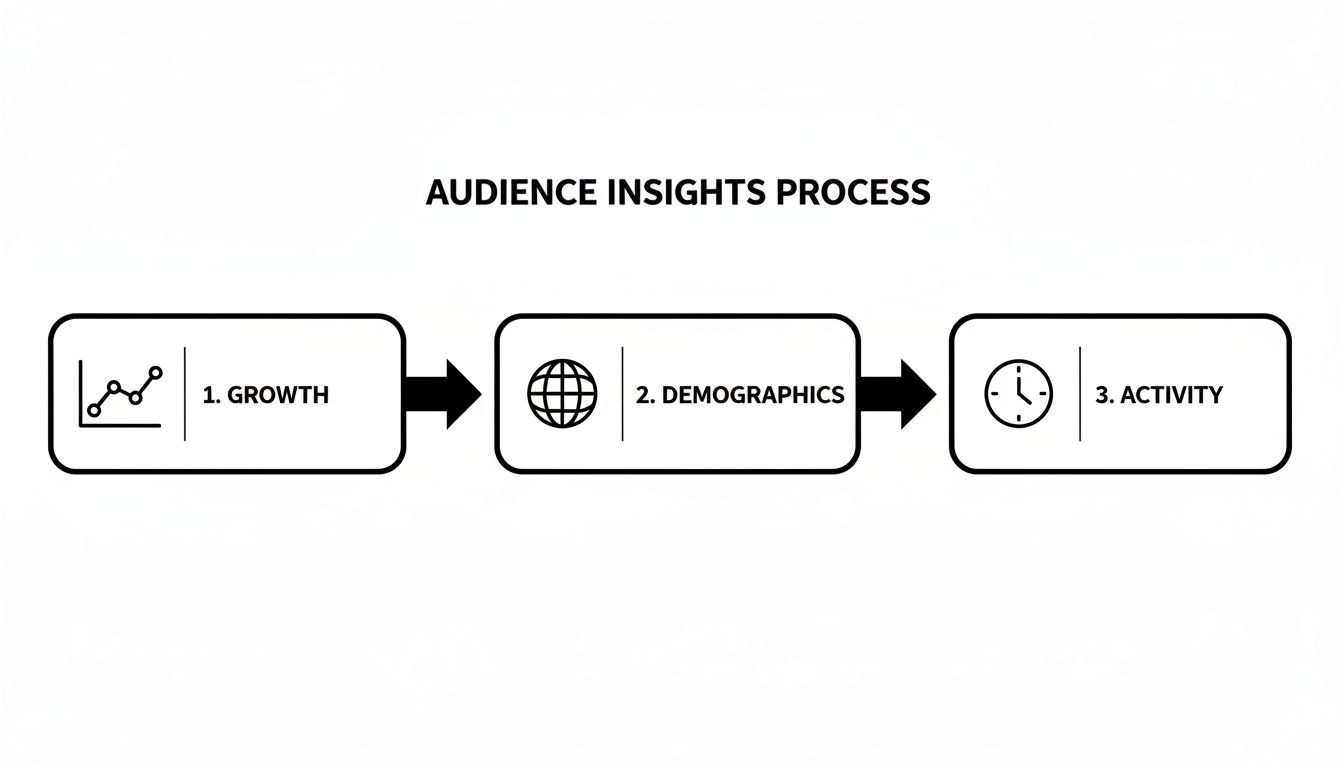
Starting with growth, then moving to demographics and activity, helps you build a complete picture. You can't just know your audience is growing; you have to know who they are and when they're online to create content that truly connects.
Turning Insights Into a Content Pipeline
So, what does this look like in the real world? Let’s say your analytics clearly show that your audience goes crazy for tutorials that solve a common problem in your niche. That single insight is a goldmine. It's the cure for creative burnout.
With that one piece of data, you can easily map out an entire month of content you already know has a high chance of success. For example:
- Week 1: A "common mistakes" tutorial showing people what not to do.
- Week 2: A "hack" video that reveals a game-changing shortcut.
- Week 3: A step-by-step "beginner's guide" breaking down a core skill.
- Week 4: An "advanced techniques" video to challenge your more experienced followers.
Just like that, your content calendar is full of ideas backed by your own performance data, not just wishful thinking.
To take it even further, see what your competition is up to. A comprehensive TikTok competitor analysis can show you how others tackle similar tutorial content and help you spot gaps you can fill. When you combine your own data with a sharp eye on the market, your content strategy becomes practically unstoppable.
Common Questions About TikTok Analytics
Jumping into your analytics can bring up a few questions. It happens to everyone. Instead of letting them derail your strategy, let's tackle the most common ones I hear from creators. Getting these sorted will help you get back to making killer content.
“Why Can’t I See My Analytics?”
This is easily the most frequent question, and the fix is almost always simple: you’re probably on a Personal account. TikTok reserves its powerful analytics suite for Creator and Business accounts.
Good news—switching is free and takes less than a minute.
- From your profile, tap the three-line menu icon at the top right.
- Head into ‘Settings and privacy’.
- Tap on ‘Account’.
- Select ‘Switch to Business Account’ (or Creator, depending on your needs).
That's it. The analytics tab will immediately show up in your Creator Tools. Just a heads-up, it might take a day or two for fresh data to start rolling in, but you’re officially unlocked.
“How Often Should I Really Be Checking My Analytics?”
I know it's tempting to refresh your stats after every post, but that’s a recipe for burnout and bad decisions. You end up reacting to meaningless blips instead of real patterns.
My advice? Make it a weekly ritual. A weekly check-in gives your videos enough time to marinate on the platform and collect substantive data. This is where you'll spot the genuine trends, not just the daily noise.
Think of your weekly analytics review as a strategic huddle. It’s your chance to step back, see what truly resonated over the last seven days, and craft a smarter, data-informed plan for the week ahead.
“Will Switching to a Business Account Hurt My Views?”
This myth just won't die, but let's clear it up once and for all: No, it won't. Switching to a Business or Creator account does not suppress your reach or hurt your views.
If anything, the opposite is true. The tools you unlock are specifically designed to help you understand what the algorithm and your audience want to see. When you use those insights, you start making content that naturally performs better and earns more views in the long run.
Ready to stop guessing and start creating with data-backed confidence? Viral.new sends AI-powered, trend-aligned TikTok ideas straight to your inbox every morning. You bring the creativity, we'll handle the data. See how Viral.new can upgrade your content strategy.
