
TikTok analytics is your direct line to understanding what's working with your videos—and what's not. It gives you the raw data on views, who’s watching, and how they’re interacting. This is how you stop guessing and start building a strategy that actually gets results.
It's the only way to get a clear roadmap for growth, moving from random posts to a repeatable system for success.
Why TikTok Analytics Is Your Secret Growth Weapon

Trying to grow on TikTok without looking at your analytics is like driving with a blindfold on. Sure, you're moving, but you have no real sense of direction. TikTok's algorithm is famously complex, but your analytics dashboard is essentially its instruction manual, written just for you.
Instead of blindly hopping on every new trend, you can use hard data to build a content plan that lasts. It helps you turn a vague goal like "get more views" into a series of smart, calculated moves based on what your audience actually wants.
Understand Your Audience and Algorithm Signals
At its heart, your video analytics TikTok data shows you the cause-and-effect relationship between what you post and how people react. This feedback is a powerful signal, not just for you, but for the algorithm itself.
Once you know how to read the numbers, you can answer the make-or-break questions that define your content strategy:
- What hooks are grabbing attention? You can see exactly which intros make people stop scrolling.
- Who is really watching my videos? Find out their age, where they live, and their most active hours on the app.
- Which video styles get the most shares? Uncover the formats that have the best shot at going viral.
- Why did that last video flop? Diagnose the problem, whether it was a weak call-to-action or a drop-off in watch time.
The sheer scale of TikTok is mind-boggling. Users watch a staggering 167 million videos every single minute. This has made it the most-used social media platform on the planet, which means there’s a massive opportunity for anyone to get discovered. You can see more details on TikTok's explosive global usage on embedsocial.com.
When you consistently check your analytics, you're basically teaching yourself to think like the algorithm. You'll start to develop an instinct for the kind of content that gets rewarded with a prime spot on the For You Page.
This data-first approach is the key difference between creators who get lucky with a one-hit-wonder and those who build a dedicated community for the long haul.
How to Find and Navigate Your TikTok Analytics Dashboard
Before you can get your hands on all the juicy data TikTok offers, you need to unlock the analytics feature. It’s a simple, one-time switch. You just need to change your standard account to either a Creator or Business account. Don't worry, both are free and give you instant access to your dashboard.
To do this, head to your profile and tap the three lines in the top-right corner to open "Settings and privacy." From there, go to "Account," and you'll see the option to "Switch to Business Account" or "Switch to Creator Account." Once that's done, you'll find the "Analytics" tool waiting for you in your settings.
Your Guided Tour of the Main Tabs
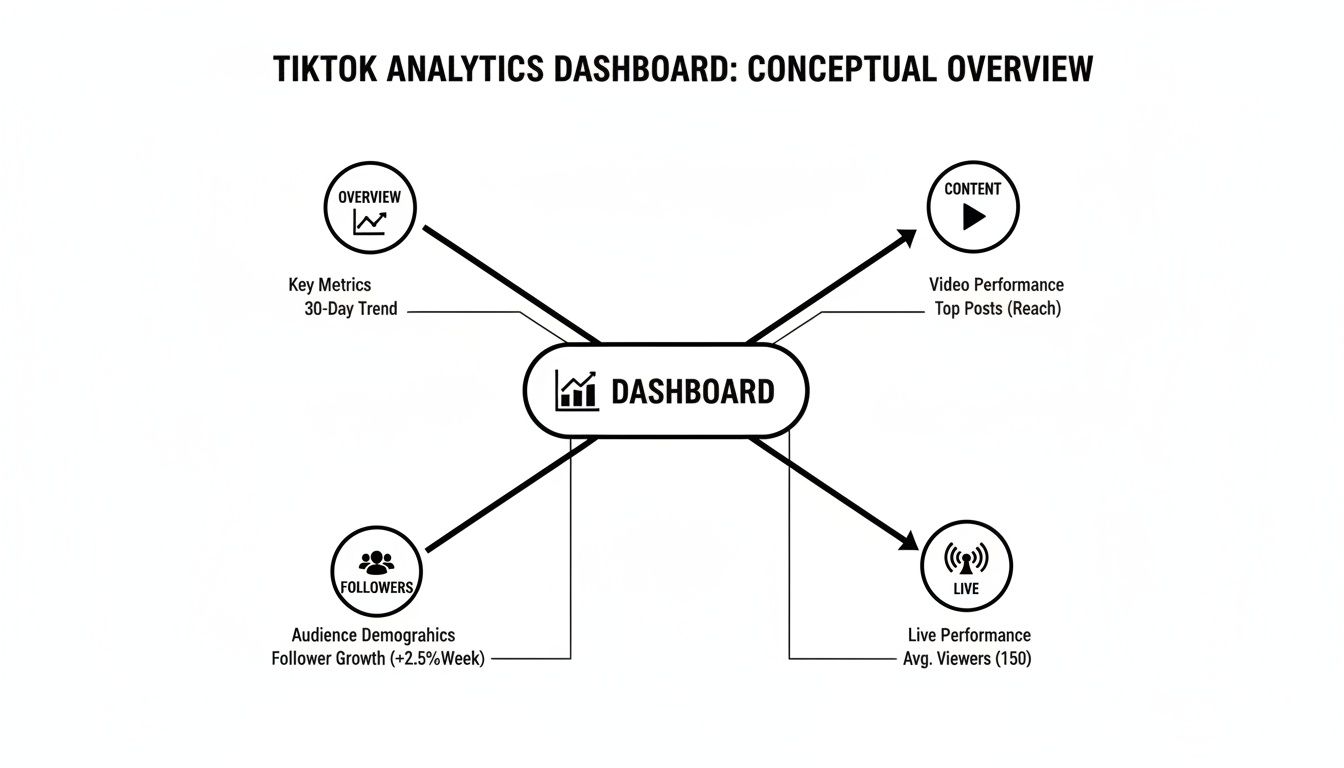
Think of your analytics dashboard as your mission control. It’s neatly organized into four main tabs, and each one gives you a different piece of the puzzle. Getting comfortable with what's inside each tab is the first step to making smarter content decisions.
Here's a look at a typical Business Account dashboard, which gives you a bird's-eye view of your key metrics.
The layout is clean and immediately shows you the important stuff—video views, follower growth—so you can spot what's happening at a glance.
Let's break down what you'll find in each section:
Overview Tab: This is your account's pulse check. It gives you a high-level summary of how you're doing over the last 7, 28, or 60 days. You'll see core numbers here like Video views, Profile views, and your Follower growth. I use this tab for a quick look at my channel's overall momentum.
Content Tab: Think of this as your video-by-video report card. It dives into the performance of every single video you've posted in the timeframe you select. Here you can see which videos are catching fire, track individual view counts, and figure out what content formats are truly resonating.
Followers Tab: This tab is all about your community. It tells you who they are—their gender, top countries or cities—and, most importantly, when they're actually on the app. The "follower activity" graph is pure gold for figuring out the best times to post. For a deeper look, check out our guide on how to see TikTok analytics and what to watch for.
LIVE Tab: If you go live on TikTok, this is your home base for data. It tracks everything from your live sessions, including Total views, New followers you picked up during the stream, and the number of Diamonds (virtual gifts) you received.
By making a habit of checking each of these tabs, you start to connect the dots. You’re no longer looking at random numbers; you're seeing the direct link between your content, your audience's behavior, and your channel's growth.
Getting to Grips with the Metrics That Matter
If you want to grow on TikTok, the first thing you need to do is stop obsessing over video views. Seriously. While seeing a big view count feels great, it's often just a vanity metric. What the TikTok algorithm really cares about is content that grabs people's attention and holds it.
Think of it this way: high-impact metrics are how you speak the algorithm's language. When you understand what it’s listening for, you can create content that doesn't just get a quick glance, but gets actively pushed out to more and more people. That’s the secret to real, sustainable reach.
Your analytics dashboard is ground zero for all this intel. It's broken down into a few key areas, each giving you a different piece of the performance puzzle.
As you can see, the Overview, Content, Followers, and LIVE tabs all work together. Each one offers a unique angle on what's working, what's not, and most importantly, why.
High-Impact vs. Vanity Metrics on TikTok
Not all metrics are created equal. Some, like Shares and Average Watch Time, tell the algorithm your content is valuable. Others, like raw follower count, can be misleading. This table breaks down the difference.
| Metric | What It Measures | Why It's High-Impact | Example Action |
|---|---|---|---|
| Average Watch Time | The average number of seconds people watch your video. | A strong indicator of viewer interest and a direct signal to the algorithm to push the video. | If your watch time is low, focus on creating a stronger hook in the first 1-2 seconds of your next video. |
| Completion Rate | The percentage of viewers who watched the entire video. | A massive signal of content quality. The algorithm loves videos people finish. | For short videos (<15s) with low completion rates, analyze where people are dropping off. |
| Shares | The number of times your video was shared with others. | An incredibly powerful endorsement that tells TikTok your content is worth spreading. | Create content that's highly relatable, useful, or funny—things people naturally want to share. |
| Saves | The number of times users saved your video to their favorites. | Shows that your content is valuable enough for someone to want to come back to it later. | If you make educational content, a high save rate means your audience finds it genuinely helpful. |
| Video Views | The total number of times your video has been viewed. | A good starting point, but it's a vanity metric without the context of watch time. | Instead of chasing views, focus on creating videos that get high watch time. The views will follow. |
| Follower Count | The total number of accounts following you. | Can be misleading. A million followers who don't engage are less valuable than 10k who do. | Look at Follower Activity to see when your current audience is online, not just the total number. |
Focusing on the high-impact metrics is how you move from guessing to knowing. You start making content that resonates, not just content that fills a slot on your calendar.
The Metrics the Algorithm Actually Cares About
So, what data points really move the needle? In the world of TikTok, a few key metrics have become the gold standard for predicting a video's success. These are the numbers the algorithm weighs most heavily when deciding whether to blast your video across the For You Page.
Average Watch Time: This is simply how long, on average, people watch your video before scrolling away. A longer watch time tells TikTok your content is sticky and engaging.
Video Completion Rate: This is the percentage of people who watch your video all the way to the end. A high completion rate is one of the strongest signals you can send—it practically screams "this is a great video!" to the algorithm.
'For You' Page Traffic: This metric shows you what percentage of your views came from the FYP. You want this number to be high, ideally over 80%. It’s direct proof that the algorithm is actively recommending your content to new people.
Reading the Signs of Audience Engagement
Beyond raw watch time, you need to understand how your audience is interacting with your videos. This is where you get a sense of connection and community. One of the most important concepts here is understanding what is engagement rate and what it says about your content's impact. For a detailed breakdown, we have a whole guide on how to calculate your engagement rate on TikTok.
Here are the other key interactions to watch:
Shares: A share is the ultimate compliment on TikTok. When someone shares your video, they're putting their own reputation on the line to recommend it. This is a massive signal for virality.
Saves: When someone saves your video, they're flagging it as valuable content they want to see again. This is especially important for educational or tutorial-style videos.
Follower Activity: Tucked away in the 'Followers' tab, this chart is pure gold. It shows you the exact days and hours your followers are most active on the app. Posting right before these peak times gives your new videos the best possible shot at getting that crucial initial traction.
Turning Your TikTok Analytics Into Actionable Insights
Understanding what your TikTok analytics mean is half the battle. The other half—the part that actually sparks growth—is knowing what to do with that information. Data without action is just trivia. This is where we bridge the gap between the numbers on your screen and the creative choices you make for your next video.
Think of yourself as a content detective. Every metric is a clue, and it's your job to piece them together. When a video flops, your analytics dashboard is the crime scene. It holds the evidence you need to figure out what went wrong, so you can fix it instead of just guessing.
Common Problems and How to Solve Them
Let's dig into a few real-world scenarios you’ll almost certainly face. By learning to diagnose the problem using specific metrics, you can create a clear plan to make your next video better. We'll use a simple framework for each: spot the metric, diagnose the problem, and find the solution.
Scenario 1: The Disappointing Drop-Off
Metric Observed: You post a video and the initial view count looks promising, but your Average Watch Time is stuck at a painful 2-3 seconds. A quick look at the retention graph confirms it: there's a steep, immediate cliff where viewers are bailing.
Likely Problem: Your hook isn't working. Plain and simple. Those first few seconds are everything on TikTok. If you don't give people a compelling reason to stop their scroll, they're gone. Your intro either didn't deliver on its promise or was just too slow to get to the good stuff.
Actionable Solution:
- Front-load the Value: Don't ease into it. Start your next video with the most exciting, curious, or visually interesting moment. Cut the slow intros.
- Try a Question Hook: Open with a question your audience is dying to have answered. Think, "Are you making this one critical mistake?"
- Test On-Screen Text: Slap a bold text hook on the screen in the very first second that spells out exactly what the video is about or what benefit the viewer will get.
A strong hook is non-negotiable. If you lose your audience in the first three seconds, the rest of your video—no matter how brilliant—might as well not exist.
Scenario 2: Crickets at Posting Time
Metric Observed: You’re a creature of habit, posting at 10 AM on the dot every day. But when you check the Followers tab in your analytics, the activity chart tells a different story: your audience is most active between 8 PM and 10 PM.
Likely Problem: You're showing up to the party after everyone has left. Posting when your followers are offline means your content is swimming upstream, fighting for every bit of early engagement. You're missing that crucial first-hour boost that tells the algorithm your video is worth showing to more people.
Actionable Solution:
- Shift Your Schedule: Start posting 30-60 minutes before your audience's peak activity. In this case, aim for around 7:30 PM.
- Monitor the Results: After a week of posting at the new time, compare the view velocity (how many views you get in the first hour) to your old 10 AM posts.
- Adjust and Refine: Keep an eye on your follower activity. As your audience grows, their habits might change, so this isn't a "set it and forget it" task.
Aligning your posting schedule with your audience's online habits is one of the easiest wins you can get from your video analytics TikTok data. It gives every video the best possible launchpad for landing on the For You Page.
Building a Smarter Content Strategy With Data

Looking at past performance is one thing, but the real magic happens when you use that data to figure out your next viral hit. It’s all about moving from just reacting to what worked to actively predicting what will work. This turns your analytics dashboard from a report card into a repeatable system for creating great content.
Your ‘Content’ tab is the best place to start this process. It conveniently ranks your videos by performance, showing you exactly what your audience has already given a thumbs-up to with their views and watch time. Look at your top one or two videos from the last 28 days—these are your creative blueprints.
Deconstructing Your Winning Videos
Your most successful content didn’t happen by accident. It followed a formula, whether you realized it at the time or not. The key is to break down your top-performing videos into their core components—their "DNA"—to see what made them tick.
Start by looking for patterns across these key areas:
- The Hook: What happened in the first 1-3 seconds? Did you ask a provocative question, show a shocking visual, or make a bold claim?
- The Format: What kind of video was it? Think tutorials, behind-the-scenes glimpses, comedy skits, or trending challenges.
- The Topic: Get specific about the subject matter. What niche did you tap into or what problem did you solve that clearly struck a chord?
- The Sound: Was it a trending audio clip, your own original sound, or a simple voiceover? On TikTok, sound is a massive driver of discovery.
Once you've identified these winning ingredients, your job is to replicate them. This doesn't mean remaking the exact same video. It means applying the successful format or hook style to a new, fresh idea.
Running Simple A/B Tests With Data
Your analytics are also the perfect tool for becoming a content scientist. Running an A/B test on TikTok doesn't have to be some complicated experiment. It can be as simple as changing one single thing between two otherwise identical videos to see which one your audience prefers.
For instance, you could test two different hooks. Make your video, then create a second version where you only change the first three seconds or the text overlay. Post them a day or two apart and keep a close eye on the Average Watch Time.
The video with the higher retention rate has the winning hook. Just like that, you have a valuable insight you can apply to all your future content. This data-backed approach to TikTok trend discovery is a game-changer for consistent growth. You can learn more about TikTok trend discovery and take your strategy to the next level in our detailed guide.
Of course, putting these ideas into action requires the right gear. To really build a smarter content strategy, you'll want to have the best content creation tools for social media that can help you execute on your data-driven insights.
Common Questions About TikTok Video Analytics
Jumping into TikTok analytics can feel like learning a new language. You've got all this data, but what does it actually mean for your next video? It's totally normal to have questions.
Let's clear up some of the most common ones. Getting these answers down will help you move past confusion and start using your dashboard to make real, impactful decisions.
How Often Should I Check My Analytics?
It's tempting to refresh constantly, but a little patience goes a long way.
For a brand-new video, give it 24-48 hours before you dive deep into the numbers. This gives the algorithm enough time to do its thing and show your video to an initial audience. After a day or two, you'll have a solid baseline for metrics like watch time and how well your hook landed.
For the big picture, I recommend a weekly check-in. Look at your 7-day and 28-day trends. This cadence helps you spot patterns in what’s working (and what's not) without getting bogged down in daily fluctuations. It's the perfect rhythm for making smart, long-term strategy shifts.
Why Can’t I See My Follower Demographics?
This is a classic "new account" problem. If you're clicking on the 'Followers' tab and seeing nothing, don't panic! It almost always means you haven't hit 100 followers yet.
TikTok keeps this data locked until you reach that first milestone.
Think of it as your first major goal. Focus your energy on creating great content to get over that 100-follower hump. As soon as you do, all that rich demographic data—age, gender, location—will unlock and tell you exactly who you're talking to.
What Is a Good Completion Rate on TikTok?
This is a great question, but the answer is: it depends on your video's length. What’s considered "good" for a 10-second clip is very different from a 60-second story.
Here are some solid benchmarks to aim for:
- For videos under 15 seconds: You want to see a completion rate of 70% or higher. People have short attention spans, so for quick videos, you need to hold them right to the end.
- For videos between 30-60 seconds: Anything above 50% is fantastic. It's much harder to keep someone engaged for a full minute, so hitting this number is a huge win.
Remember, the TikTok algorithm loves when people watch a video all the way through. It's one of the strongest signals you can send that your content is worth pushing to more For You Pages.
Where Do I Find Analytics for a Specific Video?
Finding the stats for one particular video is easy once you know where to look.
Go to your profile and tap on the video you want to analyze. From there, tap the three little dots (...) on the right-hand side of the screen. A menu will pop up—just select ‘Analytics,’ and you'll get a full breakdown just for that post.
Stop guessing and start creating with confidence. Viral.new delivers fresh, data-driven TikTok ideas to your inbox daily, tailored to your niche. Get your next viral video concept at https://viral.new.
