Ever feel like you’re just throwing content at the wall, hoping something sticks? That's what posting on TikTok without looking at your analytics feels like. One day you're viral, the next you're hearing crickets. It’s a frustrating cycle.
TikTok creator analytics are your built-in toolkit for understanding what’s actually working. Think of it less as a boring data dashboard and more as direct feedback from the algorithm and your audience. It tells you why one video popped off while another one flopped.
Why Your TikTok Growth Depends on Analytics
Relying on luck isn't a strategy—it's a fast track to creative burnout. If you're tired of guessing games, your analytics are the answer.
This isn't about becoming a data scientist. It's about switching from being a content gambler to a content strategist. Your analytics give you a roadmap, showing you precisely what your audience loves and what makes them swipe away. It's the key to creating smarter, not just harder.
Moving From Guesswork to Strategy
Analytics give you the "why" behind your performance, answering the questions that are otherwise impossible to figure out on your own:
- Who is my audience? You might be surprised. Analytics reveal the real age, gender, and location of your followers.
- When are they online? Pinpoint the exact hours your audience is scrolling so you can post for maximum reach right out of the gate.
- What grabs their attention? Find out the average watch time and where people drop off in your videos.
- How did they find me? See if viewers are coming from the For You Page, your profile, a specific sound, or search.
This is your mission control, giving you a high-level view of your account’s health over the last week. You can quickly check video views, profile views, and your follower count.
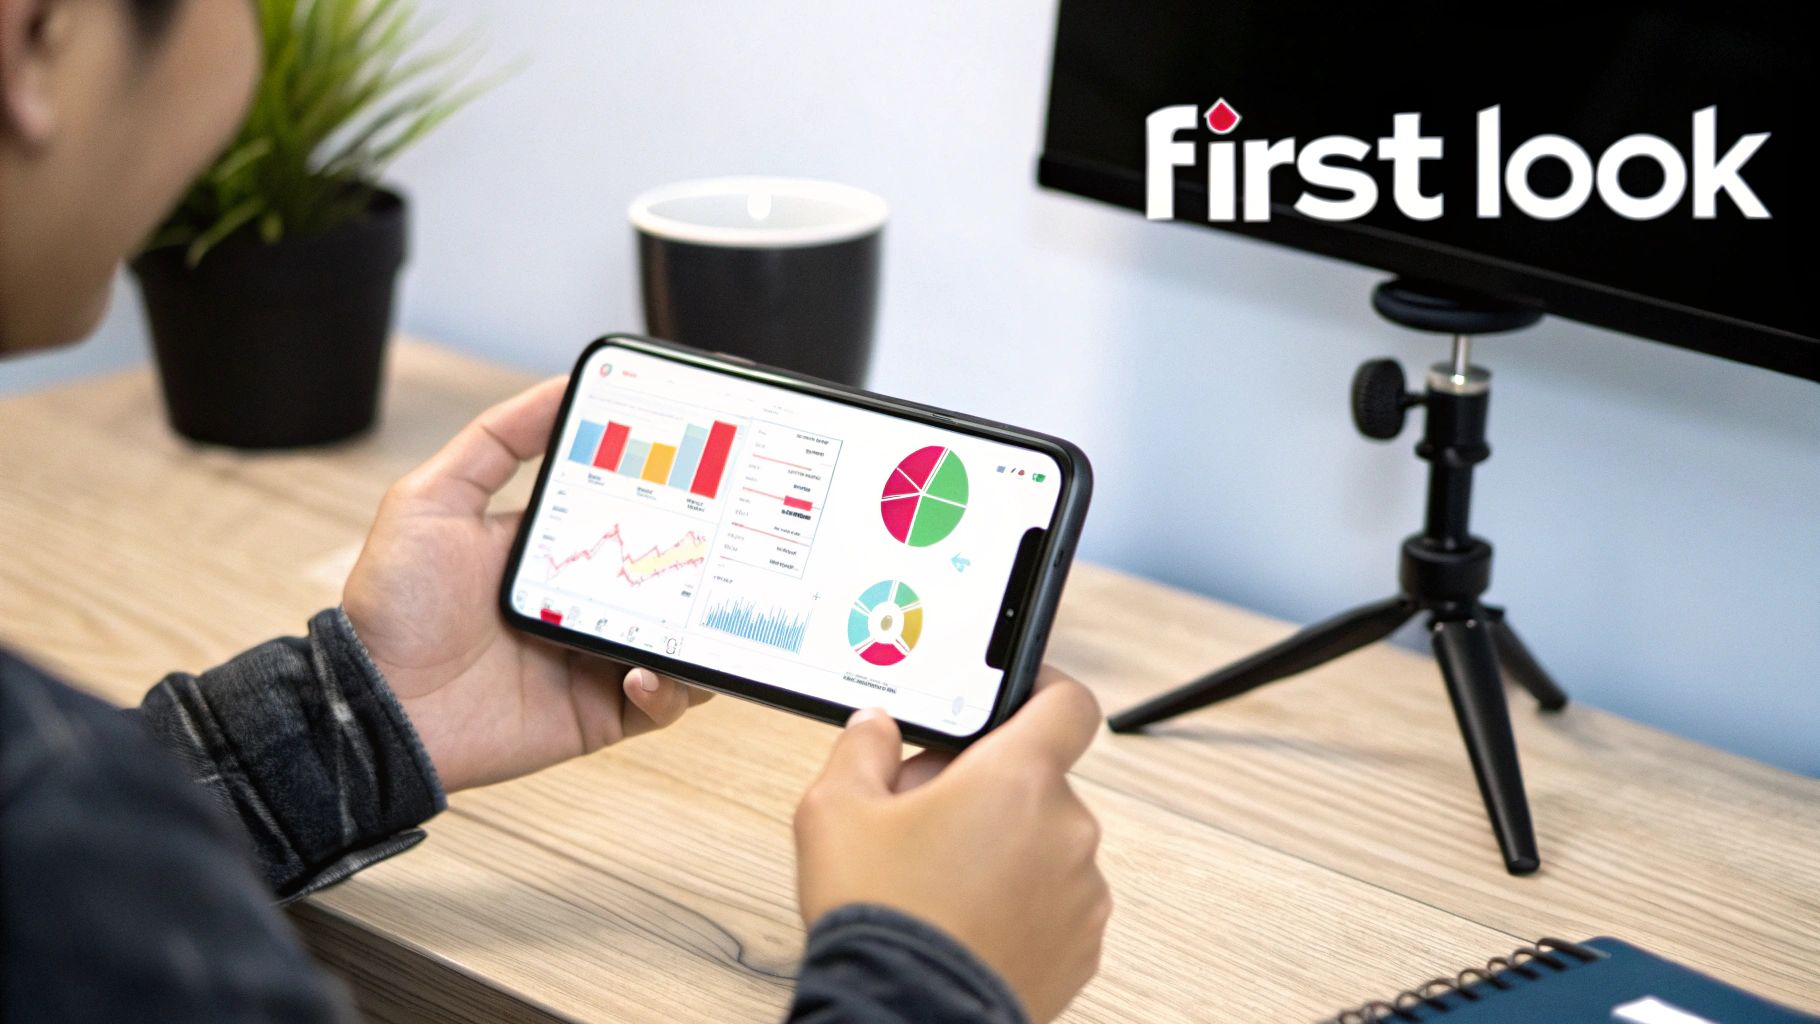
The numbers here let you spot growth trends or potential red flags at a glance, without getting lost in the weeds.
By mastering these insights, you stop creating in the dark. Every metric is a clue, and learning to read them is the single most important skill for sustainable growth on the platform.
Without analytics, you're flying blind. You’re just reacting to good or bad performance without ever knowing the cause. With them, you can start building a content engine that consistently delivers, turning those random viral moments into a repeatable formula for success. This guide will show you exactly how.
Getting to Know Your Analytics Dashboard
Opening your TikTok Creator Analytics for the first time can feel a bit like stepping into the cockpit of a 747—it’s just a wall of dials, numbers, and graphs. Don't worry. This section is your personal tour guide, designed to make that complex interface feel simple and intuitive so you can find exactly what you need, fast.
First things first, let's make sure you know where to find it. Getting there is pretty simple, but if you want a more detailed breakdown, we have a complete guide on how to see TikTok analytics.
For a quick refresher, here’s how to get in:
- Head over to your Profile page.
- Tap the three horizontal lines (the classic "hamburger" menu) in the top-right corner.
- Choose Creator Tools.
- Finally, tap on Analytics.
Once you're inside, you’ll notice the dashboard is organized into four main tabs. Think of these as different windows, each giving you a unique view of your account’s performance.
The Four Main Analytics Tabs
Each tab is built to answer a specific set of questions you might have about your videos and the people watching them.
- Overview: This is your account's 30,000-foot view. It gives you the big picture on things like video views, profile views, and follower count over the last 7, 28, or 60 days. It’s perfect for a quick health check.
- Content: This tab lets you get granular. It’s where you can zoom in on how each individual video performed, helping you figure out what specific ideas and formats are actually connecting with your audience.
- Followers: Think of this as your audience deep-dive. It reveals crucial intel on who is watching your content—their gender, where they're from, and, most importantly, when they're most active on the app.
- LIVE: If you’re a creator who goes live, this tab is your command center. It tracks everything from total views and new followers gained during a stream to your peak concurrent viewer count.
The Overview tab is really your starting point for spotting general trends. It's the first place to look to see if your overall strategy is actually working or if it's time to pivot.
Here's what that Overview dashboard looks like—a snapshot of your key performance indicators.

This simple view immediately tells a story, showing you whether your views, profile visits, and follower growth are trending up or down.
Getting comfortable with this dashboard is a non-negotiable skill, especially now. The creator economy is getting more crowded by the day. It’s no surprise that in 2025, TikTok is the favorite platform for over 45% of creators. But here's the catch: 41% of those same creators say their biggest challenge is managing their time. That makes being able to quickly analyze your data and come up with new ideas more critical than ever.
By getting familiar with these four tabs, you're laying the groundwork for a much smarter content strategy. You stop being just a creator guessing what works and start becoming an analyst who knows what drives growth.
Now that the tour is over, you’re ready to move past just finding the data. The real magic happens when you understand what these numbers actually mean and how to turn them into your next great video.
Making Sense of Your Key TikTok Performance Metrics
So, you’ve found the analytics dashboard. Great! But staring at all those numbers and graphs can feel like trying to decipher a secret code. Video views, watch time, follower activity… these aren't just random data points. They're the language the TikTok algorithm uses to tell you exactly what your audience craves and what makes them swipe away.
Let's translate this language into plain English. Think of your TikTok creator analytics as the story of your content's journey. Each metric is a chapter, revealing how a video grabbed someone's attention, held it, and maybe even convinced them to stick around. Nailing this story is the difference between a one-hit wonder and consistently creating content that connects.
Essential TikTok Analytics Metrics and What They Mean
Before we dive deep, it's helpful to have a quick reference guide. These are the core metrics you'll be looking at, and more importantly, the fundamental questions they help you answer about your content's performance.
| Metric | What It Measures | The Question It Answers |
|---|---|---|
| Video Views | Total number of times a video was watched. | Did the algorithm give my video a chance? |
| Average Watch Time | The average duration viewers spent on your video. | Was my content actually engaging enough to hold attention? |
| Audience Retention | A graph showing viewership percentage over the video's timeline. | Where exactly did I lose my audience's interest? |
| Full Video Watched | The percentage of viewers who watched to the very end. | Was my story compelling from start to finish? |
| Profile Views | The number of users who visited your profile after watching a video. | Was my video good enough to make people want more from me? |
| Follower Activity | The days and hours your followers are most active on the app. | When is the absolute best time for me to post? |
| Traffic Source | Where your views came from (e.g., FYP, Following, Search). | How are people discovering my content? |
Getting a handle on these metrics is the first step. Now, let's unpack what they really mean for your strategy.
Core Engagement and Viewership Metrics
First up are the basics—the numbers that give you a quick snapshot of how many people saw your video and if it sparked any curiosity. This is the ground floor of your analytics strategy.
Video Views: This one’s straightforward—it’s the total number of times your video has been played. But don't dismiss it as a vanity metric. A high view count means the algorithm saw something it liked and pushed your video out onto the For You Page (FYP). It's your ticket to the party.
Profile Views: This tracks how many people watched a video and were intrigued enough to tap through to your profile. Think of it as a direct measure of curiosity. A spike in profile views means your content didn't just entertain; it made people wonder, "Who is this person, and what else have they got?" This is a powerful leading indicator for new followers.
Unique Viewers: This is different from total views. It tells you how many individual accounts saw your video. If you have 10,000 views from 5,000 unique viewers, it means people were watching your video an average of two times. That's a fantastic sign that your content is re-watchable.
Understanding Watch Time and Retention
Okay, views tell you how many people showed up. Watch time and retention tell you how long they stayed and if they had a good time. Honestly, these are probably the most important signals you can send to the TikTok algorithm.
Average Watch Time is exactly what it sounds like: the average amount of time people spent watching your video before swiping. A long watch time is TikTok's favorite thing. It tells the platform your content is great at keeping people on the app, which is its number one goal.
Let's say you post a 30-second video and your average watch time is 25 seconds. You've hit a home run. That's an incredibly "sticky" video, and the algorithm will reward you by pushing it to even more people.
Think of Average Watch Time as your video's approval rating. A high percentage means you’ve successfully hooked your audience from the start and delivered on the promise of your opening seconds.
Closely related is Audience Retention, which you'll see as a graph. This chart is your secret weapon, showing you the exact moments where viewers bailed. A massive drop in the first three seconds? Your hook isn't working. A slow, gradual decline is totally normal, but sudden dips are clues. This graph helps you diagnose exactly what's working and what isn't.
Finally, there’s Full Video Watched. This metric shows the percentage of viewers who stuck it out until the very end. A high completion rate is a massive green light for the algorithm, signaling that your content is top-tier.
Deciphering Audience and Traffic Metrics
Beyond how a single video performs, your analytics tell you who is watching and how they're finding you. This is where you go from just making videos to building a real community.
Follower Activity is your guide to perfect timing. This simple chart shows you the days of the week and the hours of the day when your followers are most active on TikTok. Posting your content just before these peak times gives it the best possible launchpad to get that crucial initial engagement.
Then you have Traffic Source Types, which breaks down how people stumbled upon your video. You’ll see a few main sources:
- For You Page: This is the algorithmic feed, the holy grail of reach. A high percentage here means TikTok is successfully pushing your content to new people who don't follow you yet.
- Following Feed: These are views from your dedicated followers. Strong numbers here mean you’re doing a great job keeping your existing community happy and engaged.
- Your Profile: Views from people who came to your profile and then clicked on a video.
- Search: This is a big one. These are views from people who found your video by searching for specific keywords or hashtags. As TikTok's search engine gets smarter, this source is becoming incredibly important.
- Sound: Views from people who tapped on the sound from another video and discovered yours in the list.
Understanding where your views come from helps you diagnose what's going on. For example, getting tons of FYP traffic but very few new followers might mean your videos are entertaining on a surface level but aren't creating a strong enough connection to earn that follow.
The creator economy is absolutely exploding, and getting comfortable with these metrics is no longer optional. In 2025, creators on TikTok collectively earned an estimated $5.7 billion globally—a massive 39% jump from 2024. You can discover more insights about the explosive growth of the TikTok economy from recent reports. This kind of growth shows just how powerful and valuable a data-driven content strategy can be.
Using Data to Spot Trends and Fix Problems
Knowing what your metrics mean is one thing. Actually using them to play detective on your own account? That’s where the real growth happens. Your TikTok creator analytics aren't just a report card—they're a diagnostic tool that tells you exactly what to fix and what to do more of.
Think of each video's performance as a collection of clues. A video that gets tons of views but hardly any new followers isn't a failure; it's a piece of evidence. It tells you the content was entertaining enough for the For You Page, but it didn't create a strong enough connection to earn that follow.
In the same way, a steep drop-off in your audience retention graph within the first 3 seconds is a massive red flag. It’s a clear signal that your hook just wasn't strong enough to stop the scroll. Learning to read these patterns means you can stop guessing what went wrong and start knowing precisely how to improve.
What Your Data Is Telling You
Let's walk through a few common scenarios and what they're really telling you. If you treat these like mini case studies for your own content, you can start turning those weaknesses into major strengths.
High Views, Low Follower Conversion: You probably hopped on a broad trend that entertained a lot of people but wasn't specific to your niche. They enjoyed the video in the moment but didn't see a compelling reason to stick around for more.
Low Views, High Engagement Rate: This is a great sign! It means your video really hit home with your core audience, even if it didn't have the broad appeal to get a huge push from the algorithm. This points to a healthy, loyal community.
Steep Drop-Off After 3 Seconds: Your hook failed. Plain and simple. The opening line, the visual, or the text on screen didn't spark enough curiosity to keep people watching.
Lots of Shares, Fewer Likes: This usually happens with super relatable, funny, or useful content. People are quick to send it to a friend with a "this is so us!" message, but they might not feel the need to publicly stamp their approval with a like.
This decision tree gives you a great visual for diagnosing a video's performance right from the start.
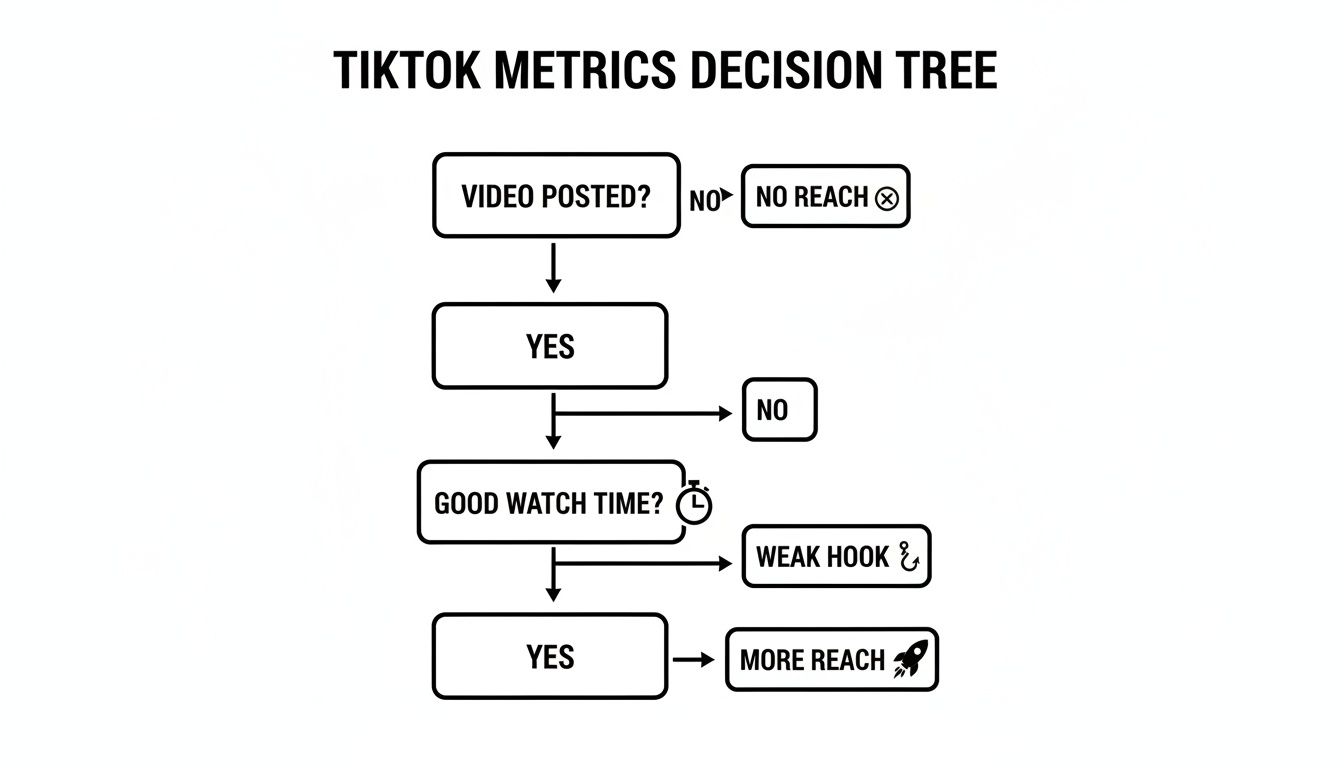
As you can see, solid watch time is the key that unlocks more reach. A bad hook, on the other hand, stops a video dead in its tracks.
Finding and Fixing Performance Issues
Once you've diagnosed the problem, the next step is to make a hypothesis and test a solution. This cycle of analyzing, adjusting, and creating again is the core of any good data-driven content strategy.
For instance, if you suspect your hooks are weak, pour all your energy for the next few videos into nailing the first three seconds. Try starting with a controversial statement, a really surprising visual, or by asking the viewer a direct question. Then, go back and check the audience retention on those new videos. Did the drop-off point move deeper into the video? If so, you're on the right track.
Your analytics are a direct feedback loop from your audience. They're telling you, "We loved this, but we got bored here." Your job is to listen and adjust.
This is also where you need to look beyond your own data and see what’s happening on the platform as a whole. Your analytics tell you what worked for your account, but you also need to know what’s working on TikTok right now. For any creator serious about growth, learning about TikTok trend discovery is a non-negotiable step to combine your personal data with what's currently capturing everyone's attention.
This approach is especially critical if you're looking to monetize. With brand deals making up 42% of all creator earnings in 2025, the ability to produce consistently high-performing content is more valuable than ever.
Identifying Positive Trends and Opportunities
Fixing problems is only half the job. Spotting and doubling down on what’s already working is just as important.
Go find those outlier videos—the ones that did way better than your average—and dissect them.
- What sound did it use?
- What was the format (talking head, tutorial, skit)?
- What topic did you cover?
- Was there a call-to-action?
You'll often discover a winning formula you can use again. If a certain tutorial style consistently gets amazing watch time and a ton of saves, that’s your audience screaming, "Make a series out of this!" This is how you build the repeatable content pillars that become the foundation of a truly successful TikTok account.
Turning Analytics Into Your Next Viral Video

Alright, so you’ve got the data. What now? Understanding the numbers is just the starting line. Insight without action is just trivia, and this is where we close the gap between analyzing and actually creating. We're going to turn your TikTok creator analytics dashboard into a repeatable formula for your next hit video.
Your analytics aren’t just a report card on what you’ve already done; they're a treasure map pointing to what you should do next.
Think about it. If your "Followers" tab shows your audience consistently lights up on Tuesday evenings, you’ve just found your personal primetime slot. If a certain video style—say, a quick-cut tutorial—always gets incredible average watch time, your audience is literally screaming at you to make more of it. These aren't just stats; they're clues that take the guesswork out of content creation.
Translating Insights Into Actionable Ideas
The best creators I know treat their analytics like a creative partner. They don't just glance at the numbers; they ask, "What story is this data telling me, and how can I write the next chapter?" This is how you shift from being reactive to being strategic.
Here’s how you can start turning those data points into real video concepts:
- Peak Follower Hours: Don’t just post during these times—schedule your best, most polished content for these windows. Whether you use TikTok’s scheduler or another tool, make sure your A-game content drops when your audience is already there and waiting.
- Top-Performing Sounds: Did a specific audio track give one of your videos a major boost? Go back to it. Try a new angle or a fresh spin on the original trend. The algorithm already likes you in connection with that sound.
- High-Retention Formats: If your "day in the life" vlogs are keeping people hooked, make them a weekly series. If your "how-to" guides get tons of saves, build an entire content pillar around educational tips for your niche. Your analytics point directly to the formats that build a loyal following.
- Winning Hashtags: Your analytics will show which hashtags actually brought in the views. To really get an edge here, digging into your TikTok hashtag analytics can uncover even more paths to getting discovered. For more on that, check out our guide on TikTok hashtag analytics.
When you start applying these lessons systematically, you’re no longer just chasing broad, platform-wide trends that might not even click with your community. You’re building a content engine that’s perfectly tuned to your specific audience.
Your analytics tell you the what and the when. They show you what your audience loved and the best time to give them more. This data is the foundation of a content strategy that actually works.
Amplifying Your Strategy With Real-Time Trends
Now, here's the thing about your personal analytics: they’re fantastic for telling you what has worked for your audience in the past. But they have a blind spot. They can’t tell you what’s about to blow up across the entire platform right now.
This is where you have to layer real-time trend data on top of your own historical insights.
Your analytics give you the strategic direction, but a tool that spots current trends gives you the creative vehicle to get there. It’s this combination that separates the creators who consistently catch viral waves from those who always feel a step behind.
Building Your Data-Informed Content Workflow
Let's put this into practice. Imagine your analytics reveal that short, educational videos drive the most profile visits for you. Awesome. Now, instead of brainstorming from scratch, you can use a tool like Viral.new to get daily, trend-aligned ideas specifically for educational content in your niche. It hands you ready-to-shoot concepts that fit the exact format you already know resonates with your audience.
This completely changes your workflow. It becomes a simple, repeatable cycle:
- Analyze Your Data: Once a week, dive into your TikTok creator analytics to spot your winning formats, topics, and posting times.
- Identify Current Trends: Hop on a tool like Viral.new to find trending sounds, effects, and video concepts that you can merge with your winning formats.
- Create and Execute: Film your next video, combining your proven format with a currently trending element.
- Measure and Repeat: Post at your optimal time, then check the new data to see what you can learn and refine for the next video.
Suddenly, content creation isn't a chaotic, stressful scramble anymore. It’s a predictable process. You're no longer just throwing content at the wall to see what sticks; you're making smart, data-informed decisions that give every single video the best possible shot at connecting with your audience and taking off.
Turning Data into Your Content Flywheel
So, we've walked through finding your analytics, figuring out what all those numbers mean, and spotting problems. Now, let's tie it all together. The real jump from being confused by data to being a data-driven creator boils down to a single, powerful idea.
Think of your TikTok creator analytics as a direct line to your audience. They're literally telling you what they want to see next.
This feedback loop is what separates creators who burn out from those who build something lasting. It’s not about chasing one-off viral hits; it's about creating a system where every single video you post is smarter than the one before it. This is what I call the 'Content Flywheel'—a system that starts slow but picks up unstoppable momentum over time.
The 4 Steps of the Flywheel
The process is a simple, repeatable cycle that takes all the guesswork out of your content strategy.
- Post: You create and publish a video based on what you already know works.
- Analyze: Give it a few days, then dive into the analytics. See what the real-world data is telling you.
- Learn: Pinpoint the key takeaways. Did the hook grab people? Was the format a hit? Did you post at the right time? What was the one thing that made people stick around—or swipe away?
- Optimize: Take what you just learned and bake it into your very next video idea.
This loop ensures you’re constantly sharpening your strategy based on what your audience actually does, not just what you think they want. Each turn of the flywheel makes your content stronger and your growth more predictable.
Think of your analytics as the blueprint and your creativity as the construction. You can't build a solid house with just one or the other. But when you put them together, you build an account that can stand the test of time.
The final step is to actually do it. Open your analytics today with fresh eyes. Find just one key insight—one thing you can improve. Then, pair that strategic discovery with a creative tool like Viral.new to bring the idea to life. This is how you close the loop, turning your audience data into a consistent stream of content that truly performs.
Got Questions? We’ve Got Answers.
Even after you get comfortable with your analytics, you're bound to have some questions pop up. It happens to everyone. Let's tackle some of the most common ones I hear from creators so you can get back to making great content, armed with the right info.
How Many Followers Do I Need to See My Analytics?
This is probably the biggest myth out there. People think you need 10,000 followers or some other magic number to unlock your data, but that’s just not true.
The good news is, you don't need a single follower to get started. All you have to do is switch your personal account over to a free Creator or Business account, and the analytics tab will appear. Seriously, that's it. You can start learning from your data from day one.
How Often Should I Actually Check My Numbers?
It’s easy to get obsessed and refresh your stats every five minutes. It's also easy to forget about them for a month. The sweet spot is somewhere in the middle.
I recommend a simple two-part rhythm:
- A quick daily check: Peek at your newest video’s performance a few hours after posting. This gives you a fast read on whether the hook landed.
- A weekly deep-dive: Set aside time once a week to look at the bigger picture. Are your followers growing? What content formats performed best over the last seven days?
Think of it like this: The daily check is like a quick taste-test while you're cooking. The weekly review is like sitting down to enjoy the full meal and deciding what you want to cook next week.
Help! Why Did My Views Suddenly Drop Off a Cliff?
First off, take a breath. It happens to every single creator, and it's almost always fixable. A sudden drop in views is a signal, and your analytics are the key to decoding it. It's usually not one big thing, but a mix of a few factors.
Here are the usual suspects:
- You tried something new: Maybe you experimented with a different video style or topic that just didn't connect with your usual audience.
- You posted at a weird time: If you posted when your followers were asleep or at work, the video never got that initial push.
- Your hook was weak: A boring first 3 seconds means people scrolled right on by. Ouch.
To figure out what happened, dive into the analytics for that specific video. A low average watch time that drops off immediately points to a bad hook. If your "For You" page traffic is way down, it means the algorithm struggled to serve it to the right people from the start.
Ready to turn those analytics insights into videos you know will work? Viral.new sends you daily, trend-backed video ideas so you can stop guessing what to create next. Start making smarter content today by visiting https://viral.new.
